CF Proteomics
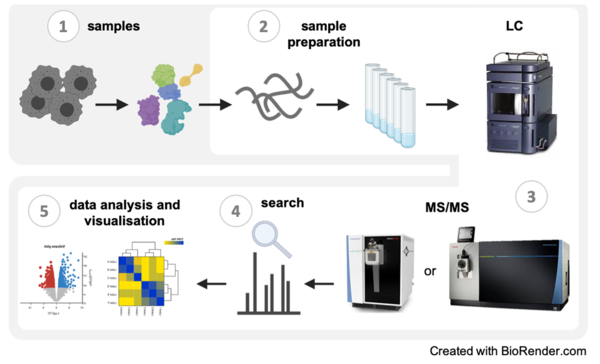
The Proteomics Core Facility provides a full service from sample preparation (2) to data analysis and visualization (4) for the identification and quantification of proteins using mass spectrometry. We have experience with samples (1) from various sources and organisms and are equipped with state-of-the-art chromatography systems and mass spectrometers (3) that enable multiple LC-MS and LC-MS/MS experiments.
1. Samples:
- types: primary cells, FACS sorted cells, protein and organelles IPs, proximity labelling (BioID, APEX), different tissues including Formalin Fixed and Paraffin Embedded (FFPE), etc. ...
- organisms: E. coli, C. elegans, M. musculus, N. furzeri, H.sapiens, S.aureus etc.
2. Sample preparation:
- digest: in-solution, on-beads or in-gel
- desalting with OASIS solid phase extraction systems (Waters)
- optional: high pH reversed phase fractionation
- optional: phosphopeptide enrichment with AssayMAP Bravo (Agilent), ubiquitin and acetylation enrichment (kit)
- optional: Automated BioID
- optional: Low input samples with lysis and digestion using Covaris R230 (Covaris)
- quantitation: label-free DIA or TMT
3. LC-MS/MS (key instruments):
- Exploris 480 with FAIMS (Thermo)
- Orbitrap Fusion Lumos Tribrid (Thermo)
- LC system: nanoAcquity UPLC (Waters) and M-Class UPLC (Waters) and EvosepOne (Evosep)
4. Search software:
- (Biognosys) using (Biognosys) (Bruderer et al. 2015)
- (Freeware, Cox et al. 2008) using Andromeda (Freeware, Cox J et al. 2011)
- Mascot server (Matrix Science) (Perkins et al. 1999)
5. Data analysis and visualisation:
- in-house developed procedures build on R\Bioconductor
- Spectronaut (Biognosys)
- Proteome Discoverer (Thermo)
- SpectroDive (Biognosys)
- SpectroMine (Biognosys)
- (MacCoss Lab) (MacLean et al. 2010)]
References
- Bruderer, R. et al. Extending the limits of quantitative proteome profiling with data-independent acquisition and application to acetaminophen-treated three-dimensional liver microtissues. Mol Cell Proteomics. 14(5):1400-10 (2015).
- Cox, J. & Mann, M. MaxQuant enables high peptide identification rates, individualized p.p.b.-range mass accuracies and proteome-wide protein quantification. Nat. Biotechnol. 26, 1367-72 (2008).
- Cox, J. et al. Andromeda: a peptide search engine integrated into the MaxQuant environment. J. Proteome Res. 10, 1794-805 (2011).
- Perkins, D.N. et al. Probability-based protein identification by searching sequence databases using mass spectrometry data. Electrophoresis 20, (18) 3551-67 (1999).
- MacLean, B. et al. Skyline: an open source document editor for creating and analyzing targeted proteomics experiments. Bioinformatics 26, 966-8 (2010).
Protein profiles and abundance
For our standard proteomic workflow, we use data independent acquisition (DIA) that enables us not only to identify, but also to compare abundancy changes of thousands of proteins between samples. In the traditional data dependent mode (DDA) only a few peptides are chosen for fragmentation. This led to several missing values between samples, which made a reliable quantification difficult. The advances in instrument technology allows us now to fragment every peptide in a sample using DIA and newly developed software allow us to analyse the information coming from these data (for more info, please refer to e.g. Ludwig et al. 2018).
In addition, we also offer tandem mass tag (TMT) labelling coupled with high pH fractionation, which is especially helpful for lower abundant proteins (Pappireddi et al. 2019). Fractionation of peptides prior to MS analysis reduces the complexity and in turn increases detection sensitivity. But it also reduces accuracy for quantitation due to differences between different fractionations. To remove this variable, peptides from different samples are labelled, mixed and fractionated together. TMT are isobaric tags that have the same chemical structure, so they behave the same during ionisation of the peptides in the MS. Only after the fragmentation of the peptides the tags can be distinguished and used for quantification.
Protein-protein interactions
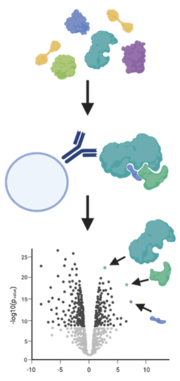
A simple way to analyze protein-protein interaction is the enrichment of a protein of interest with an antibody (immunoprecipitation) or a tag (e.g. GFP-trap) from their native environment. By using mild conditions, interactions with other proteins are not disrupted and these binders are also pulled out of the sample.
A method to catch weak binders that are washed off during standard immunoprecipitation is BioID. Here, the protein of interest is fused with engineered biotin ligases, e.g., BirA*, that labels all proteins in its close proximity with a biotin tag. More importantly this happens while the protein is still in its native environment. The labelled proteins are then purified with streptavidin beads and identified and quantified by mass spectrometry (Varnaité and MacNeill 2016, Mackmull et al. 2017).
Posttranslational modifications
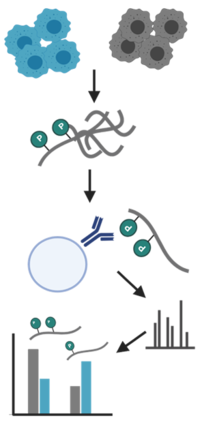
Posttranslation modifications are important to understand the function of proteins as they can regulate activity, induce localisation changes and facilitate interactions. However, analysing these modifications is often impeded by their low abundance. In the facility, we have implemented workflows to enrich and identify phosphorylation (AssayMAP Bravo Technology, Agilent), ubiquitination, acetylation and glycation of peptides (Di Sanzo et al. 2020).
Low input, high throughput proteomics analysis
In recent years, low input and single cells technologies have become more and more popular. These techniques allows to investigate systems where the sample amount is limited, as well as to study tissues at a higher resolution, distinguishing different cell populations. The use of low cell amount in combination with automatized sample preparation, fast chromatography and faster mass spectrometric analyzer allows high throughput proteome analysis with deep coverage and excellent resolution. The FLI core facility offers routine analysis from 10000 down to 2000 cells, aiming to reach single cell resolutions.
References
From our group:
- Kelmer Sacramento, E. et al. Reduced proteasome activity in the aging brain results in ribosome stoichiometry loss and aggregation. Mol. Syst. Biol. 16, e9596 (2020).
- Buczak, K. et al. Spatially resolved analysis of FFPE tissue proteomes by quantitative mass spectrometry. Nat. Protoc. 15, 2956-2979 (2020).
- Chen, Z. et al. Cohesin-mediated NF-κB signaling limits hematopoietic stem cell self-renewal in aging and inflammation. J. Exp. Med. 216, 152-175 (2019).
- Gebert, N. et al. Region-Specific Proteome Changes of the Intestinal Epithelium during Aging and Dietary Restriction. Cell Rep. 31(4):107565 (2020).
- Wyant, G.A. et al. NUFIP1 is a ribosome receptor for starvation-induced ribophagy. Science 360(6390):751-758 (2018).
- Muntel, J. et al. Comparison of Protein Quantification in a Complex Background by DIA and TMT Workflows with Fixed Instrument Time. J. Proteome Res. 18, 1340-1351 (2019).
- Mackmull, M.-T. et al. Landscape of nuclear transport receptor cargo specificity. Mol. Syst. Biol. 13, 962 (2017).
- Di Sanzo, S. et al. Mapping sites of carboxymethyllysine modification on proteins reveals its consequences for proteostasis and cell proliferation. (2020), preprint
Other groups:
- Ludwig, C. et al. Data-independent acquisition-based SWATH-MS for quantitative proteomics: a tutorial. Mol. Syst. Biol. 14, e8126 (2018).
- Pappireddi, N., Martin, L. & Wühr, M.A Review on Quantitative Multiplexed Proteomics. Chembiochem 20, 1210-1224 (2019).
- Varnaitė, R. & MacNeill, S.A. Meet the neighbors: Mapping local protein interactomes by proximity-dependent labeling with BioID. Proteomics 16, 2503-2518 (2016).
Which surfactants are compatible with MS?
In our facility we have good experience with sodium dodecyl sulfate (SDS) and sodium deoxycholate (SDC), as we have protocols for the removal of both prior to MS analysis. An alternative is RapiGest that can also be removed with acid precipitation.
What kind of sample do we normally receive?
We have received a variety of samples from tissue to lysate and everything in between. Please talk to us and we will figure out at which step it would be best for us to take over the sample preparation of your project.
For cells and tissues, we generally request to provide snap frozen cell pellets (please remember to provide estimated cell number or tissue weight for each sample and to store samples at -80°C prior to analysis). If lysates are provided, exact composition of lysis buffer and estimation of protein concentration, e.g., by BCA or Bradford assays are required for each sample.
For cells obtained by FACS, we generally provide our own lysis buffer for sample collection. Please contact us in advance. Critical for successful analysis is to minimize the sample volume (the best strategy for this can be discussed with the FACS facility).
For identification of gel bands, a representative gel picture is required. However, for processing the sample, we prefer to run our own gel and staining procedures. Please discuss with us how to hand over the samples.
For IPs, we request to provide us with immunoblot showing successful isolation at least of the bait protein.
For human samples from patients or S2 samples, please contact us before planning and proceeding with experiments. We cannot accept any human or S2 samples without proof of inactivation.
How much material do we need?
This depends on what kind of question you want to answer. For an in-depth identification and label free quantitative proteomics analysis 20-30 µg of proteins are generally sufficient (typically corresponding to 200-300k mammalian cells). Analysis of posttranslational modifications that include dedicated enrichment steps, require more starting material: typically 200 µg (~2e6 cells) for phosphorylation and 1-5 mg (1-5e7 cells) for other posttranslational modifications. For IPs and proximity labelling experiments, we generally recommend to start from 1-2e7 cells, however the amount of material required might vary depending on the abundance of the bait protein. In any case, please talk to us prior to performing the experiments and we will try to find a solution.
How many replicates do I need?
For all our quantitative experiments, we require a strict minimum of 4 biological replicates per condition. The definition of biological replicate depends on your experiment, however, as a rule of thumb, biological replicates can be defined as independent animals for primary cells and tissues, and cells collected at different passages for isogenic cell lines. Please bear in mind that for specific experiments (e.g., animal experiments), higher number of replicates might be required, ideally supported by appropriate power calculations.
For IPs and proximity labelling experiments, please include appropriate controls, e.g., mock IPs, isotype controls, etc…
In any case, the exact experimental design should be discussed with the facility staff prior to the experiment.
How long does it take to receive my results?
This is a difficult question to answer as it depends on several factor, like the number of samples, the proteomics experiment you want to do and also how busy we are at the moment. Just as a rough guideline for you: sample preparation takes normally 3 days if no further fractionation is required. An in-depth run takes about 2.5h for most of the samples. Keep in mind that we may also have to check the samples with a shorter gradient prior to the actual in-depth acquisition. Typical turn-around time from sample drop-off to data reporting are 6-8 weeks.
What kind of results am I going to receive and how do I interpret them?
Your results and the way to interpret them depends both on the nature of your experiment, your questions as well as the way the data were acquired. Here you can find a summary of what you might find in a or in a . You will receive these files together with your report.
What are the most common contaminants?
Keratin is the most common contaminant and you will find it in every MS analysis. If the amount of Keratin is very high, the peptides coming from keratin might mask the peptides coming from your proteins of interest. To minimize the contamination always work with gloves and avoid touching your samples directly (e.g. gels) as much as possible. Clean your bench and equipment with ethanol before preparing your sample.
Another common contaminant is albumin, especially when working with cells from cell culture or FACS stained cells. Similar to keratin high amounts of albumin might mask the signals from your proteins of interest. So, please wash your cells with PBS thoroughly.
Hemoglobin from erythrocytes is another common contaminant. Please try to remove erythrocytes from your samples.
Surfactants like e.g. CHAPS ionise very well and can mask your peptides. More importantly, they can induce ion suppression. Please read the FAQ on surfactants for more information.
Plasticwares are also a common contamination source. Especially, plasticizers and polypropylene glycol can leach out from the plastic labware, leading to background signals during MS analysis. We recommend safe-lock Eppendorf tubes for MS analysis, preferably low-protein binding tubes if you have low amount of sample material.
Which buffer do you prefer for the samples?
We are fine with most of the buffers. However, there are some commonly used additives/components that should be avoided.
Please do not use carrier proteins like e.g. BSA. The high concentration of carrier proteins will mask the proteins of your samples.
Surfactants could also be problematic for our analysis. Detergents ionise very well and can mask your proteins and are very hard to remove from the LC column. There are some detergents that are easier for us to remove. Please talk to us beforehand, if you need to use detergents.
For FACS sorted cells we prefer if the cells are directly sorted into our lysis buffer. Please contact us if you need lysis buffer and we will provide it to you.
Why do I see only so few proteins?
Contaminations are the most common cause for low number of identified proteins. Please read the FAQ on contaminants for more information.
Anyone wishing to perform a proteomics experiment with the facility should contact the facility well in advance of any sample preparation steps, in order that through discussion, the best experimental design is achieved for the desired outcome of your experiment. Failure to do so may result in issues handling your samples or in the worst case they cannot be measured (e.g. protocols don’t exist to handle them in the way you prepared).
When your samples are ready please fill out and send us the sample submission form and a sample description in a spreadsheet format (Excel or similar). Please ensure that the samples are labelled correctly and all the information we need (e.g. samples name, protein amount estimation, sample volumes) is provided in the sample description. Without this information we won’t process the data.
We have a sample drop off point (-20°C freezer). Please leave your samples there and email us that you put your samples there, so we can transfer you samples to -80°C. ()
Please send all your emails to proteomics@~@leibniz-fli.de.
Internal users:
External users:
Please inquire at proteomics@~@Leibniz-fli.de.
For publications of individual CF members: publications search
Contact

Emilio Cirri
CF Manager
+49 3641 65-6164 / 6433 (MS Lab)
proteomics@~@leibniz-fli.de
Alessandro Ori
Scientific Supervisor
alessandro.ori@~@leibniz-fli.de
Group Website


